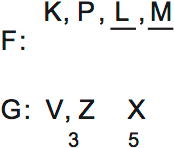
These diagrams show the rules used to determine the possible distribution of the bonuses to the employees in the Finance (K, L, M, P) and Graphics (V, X, Z) departments.
Refer to these diagrams when solving this game. Copy them on your own page, and on each question make a new version of them in order to follow along with my explanations. You’ll learn much more if you draw along.
The setup section explains how to build this diagram.
Main Diagram

The graphics department is fully determined. The lines under L and M indicate that they have higher bonuses than K and P.
The possibilities for the finance department are $1000, $3000 or $5000.


I wanted to say your explanations have been great! I took an LSAT course which I spent a lot of money on, and decided after that self study would be the best for me. I am currently taking 3-5 practice tests a week to be ready for the LSAT in Feb. I am so thankful for your step by step examples since I am still having struggles with the logic games. So wonderful you have taken the time to offer this site to everyone who is prepping for this crazy exam. It is much appreciated.